


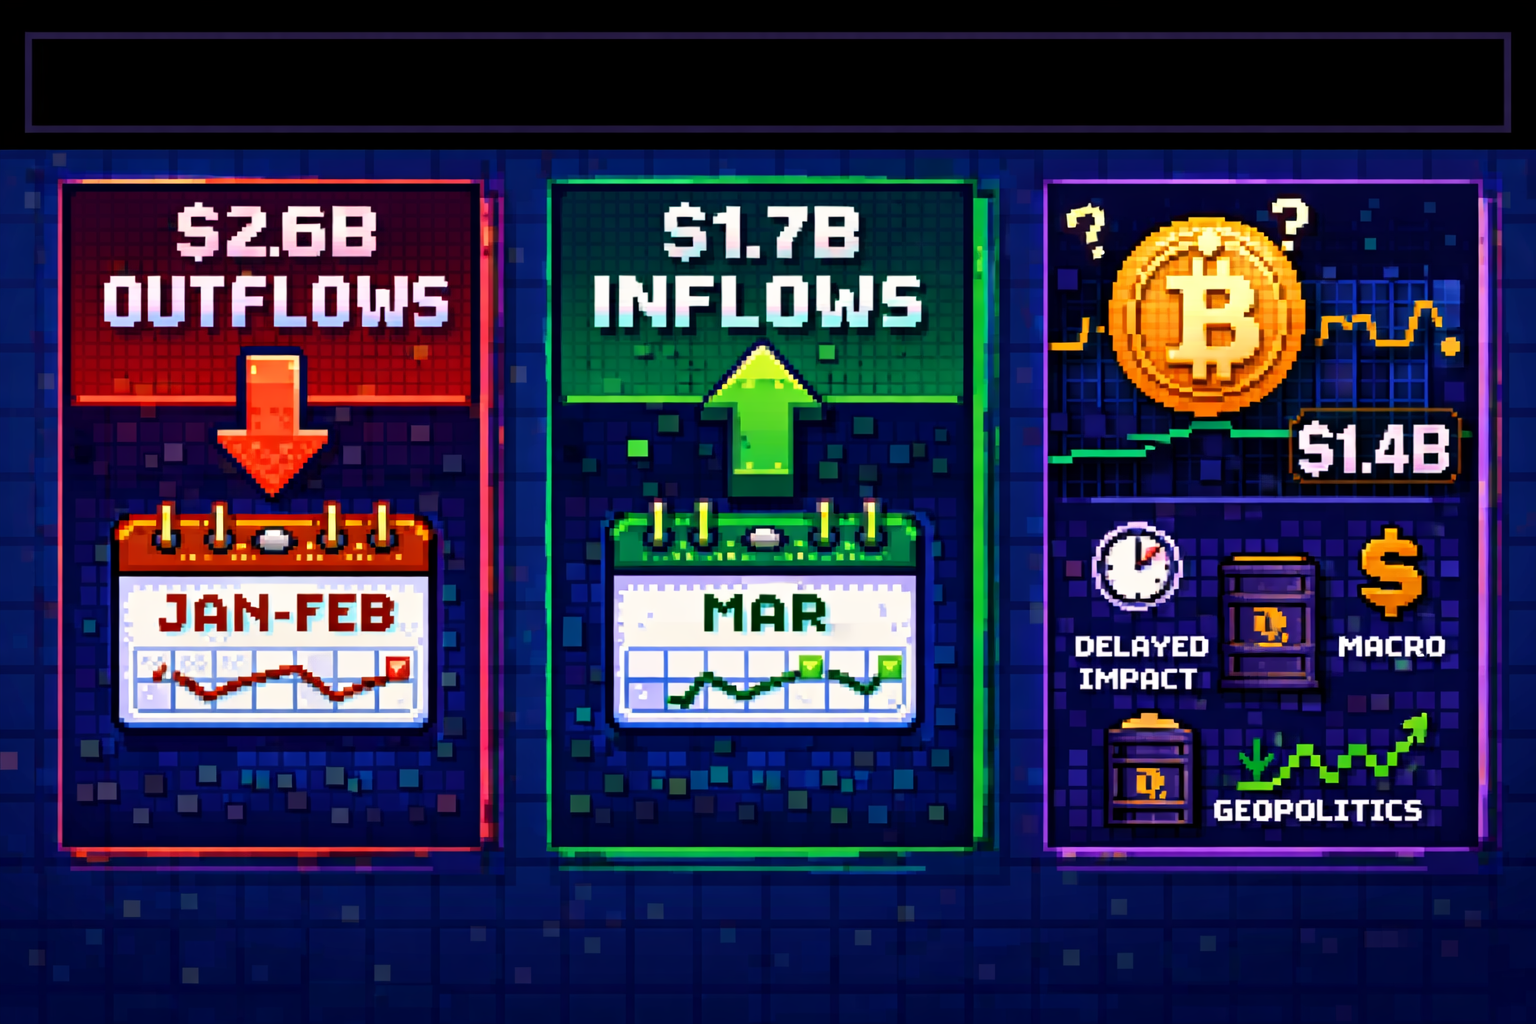
Bitcoin is trading near $70,400 as of mid-March 2026, up roughly 7% from Sunday’s lows and 20.5% from its February bottom. The recovery comes as spot Bitcoin ETFs have flipped from months of outflows to significant inflows – $1.7 billion since late February, including nearly $1 billion into BlackRock’s IBIT alone .
But here’s the puzzle: despite $1.4 billion in ETF inflows over just five days, Bitcoin’s price has remained largely range-bound . Analysts point to ETF mechanics, geopolitical tensions (the Iran conflict pushing oil toward $100), and macro uncertainty as countervailing forces.
In this analysis, we’ll break down the current Bitcoin price dynamics: what ETF flows are really telling us, key support and resistance levels, the shifting correlation with gold, and what to watch for in the coming weeks.

Current Market Snapshot: Bitcoin at $70,000+
The Numbers (as of March 2026)
| Metric | Value |
|---|---|
| Bitcoin price | ~$70,400 (up 7% from weekly lows) |
| February low | ~$63,000 |
| Recovery from bottom | 20.5% |
| Year-to-date performance | Down ~16% from January highs |
| All-time high (October 2025) | ~$126,000 |
Recent Price Action
Bitcoin has climbed quietly but steadily, outperforming major stock averages. Over the past five days, BlackRock’s IBIT is up 3.75% while the iShares Expanded Tech-Software ETF (IGV) is down 2.45% – a notable decoupling from the tight correlation with software stocks that dominated recent months .
On March 13, Bitcoin demonstrated remarkable resilience, holding above $71,000 even as the S&P 500 and Nasdaq Composite registered losses of 2.4% and 3.1% respectively . This decoupling has reinvigorated the “digital gold” narrative.
Geopolitical Context
This resilience is particularly striking given escalating tensions between Iran and the U.S., with oil prices nearing $100 per barrel due to Iran’s closure of the Strait of Hormuz . Historically, such risk-off events would pressure Bitcoin; instead, it’s held firm.
ETF Flows: The Dramatic Reversal
The Outflow Period (January-February 2026)
Bitcoin ETFs started 2026 in a deep freeze. From mid-October through late February, spot Bitcoin ETFs recorded cumulative outflows of about $9 billion. Year-to-date through February, net outflows reached $2.6 billion, a stark contrast to the $4.3 billion in net buying during the same period of 2025 .
The Turning Point (Late February-March)
Starting February 24, the tide turned. Investors have added approximately $1.7 billion to spot Bitcoin ETFs, marking the longest stretch of inflows (three weeks) since July 2025 .
| ETF | Recent Flow Highlights |
|---|---|
| BlackRock IBIT | Nearly $1 billion in March inflows after losing $3B+ between Nov-Feb |
| Fidelity FBTC | Significant inflows; key indicator per analysts |
| ARK 21Shares ARKB | Strong correlation with BTC price movements |
| Grayscale GBTC | Remains largest institutional vehicle but continues to see mixed flows |
In the first week of March alone, spot Bitcoin ETFs saw about $568 million in inflows, and the monthly total reached $1.56 billion . The funds are on track for their third straight week of inflows – the longest stretch since July 2025 .
The $55 Billion Milestone
Cumulative net inflows across all U.S. spot Bitcoin ETFs now stand at approximately $55.57 billion, underscoring how deeply institutionalized Bitcoin has become . Blockstream’s marketing director recently noted that Bitcoin ETFs have pulled in roughly the same amount of cumulative investor money as gold ETFs collected over their first 15 years, and Bitcoin did it in less than two years .
The Puzzle: Why Isn’t Price Rising Faster?
The $1.4 Billion Question
Over a recent five-day period, spot Bitcoin ETFs attracted about $1.4 billion in inflows, yet Bitcoin’s price remained largely unchanged. How can that be?
Bitfinex Analysts’ Explanation
Analysts at Bitfinex explain that ETF inflows can be misread as immediate spot demand due to the mechanics of ETF creation and redemption:
| Step | Process |
|---|---|
| 1. ETF demand rises | Shares trade above net asset value |
| 2. Authorized Participants (APs) act | APs create new shares to meet demand |
| 3. APs can short first | Regulators allow APs to short ETF shares almost immediately |
| 4. Bitcoin buying delayed | Actual BTC purchases may occur hours later or next day |
| 5. Lag effect | Bullish pressure on price takes time to materialize |
“The ETF grows, but the actual BTC price doesn’t rise because there has been no buying in the spot market. This can make the BTC price feel ‘stuck’ or suppressed,” the analysts explain. In periods of market dislocation, this gap can create temporary mispricing .
Additional Factors
Other forces offsetting ETF inflows include:
| Factor | Impact |
|---|---|
| Geopolitical tensions | Iran conflict, oil near $100 |
| Low trading volume | Spot volume at lowest since Nov 2023 |
| Whale activity | Whale ratio at 0.64 (highest in 10 months) |
| Macro uncertainty | Fed policy, inflation data pending |
The daily breakdown shows choppiness beneath the surface: large inflows early in the week gave way to sizable redemptions by Thursday and Friday, a pattern suggesting some investors remain cautious even as fresh money enters .
Key Price Levels to Watch
Technical Analysis Overview
Bitcoin remains in a downward trend from its $126,000 peak, but recent price action shows buyers pushing back against the decline . Here are the critical levels to monitor:
Upside Levels (Resistance)
| Level | Significance |
|---|---|
| $71,900 | First key barrier; Fibonacci 0.144 level |
| $77,780 – $78,500 | Major test zone; includes Fib 0.236 and 3-month EMA |
| Above $78,500 | Would suggest shift toward constructive trend |
Downside Levels (Support)
| Level | Significance |
|---|---|
| $69,000 | First short-term support |
| $66,000 – $67,000 | Next support zone if $69k breaks |
| $62,800 | “Main line of defense” – holding here keeps bottom structure intact |
| $60,000 | Strong psychological and technical support (tested Feb 5) |
| $57,500 | Next level if $60k breaks |
On-Chain Context
Long-term holders are strengthening the $60,000 floor, with data showing increased coin aging. The 12-18-month UTXO cohort has grown from 9.67% to 11.09%, indicating more Bitcoin is aging into long-term storage . A low Binary Coin Days Destroyed (CDD) reading of 0.14 reinforces that older coins remain dormant .
Analyst Sentiment
Rania Gule of XS.com notes: “The broader bias remains bearish as long as price stays below $75,000. However, maintaining stability above $60,000 keeps the rebound scenario viable.”
Bitcoin’s Shifting Correlation with Gold
A Notable Shift
One of the most interesting developments in March 2026 is Bitcoin’s changing relationship with gold. According to Bryan Tan, trader at Wintermute, the BTC-gold correlation has flipped positive, moving to +0.16 from -0.49 just a week ago .
What This Means
| Period | Correlation | Market Behavior |
|---|---|---|
| Early Iran conflict | Negative | Bitcoin fell, gold rallied (classic risk-off) |
| Recent days | Positive | Both assets rose together, dollar weakened |
Tan’s Analysis
“This shift suggests investors may be starting to treat Bitcoin and gold as beneficiaries of dollar softness rather than opposing risk trades. If this correlation continues trending positively, it shifts the narrative around BTC in a conflict environment from ‘sell the risk asset’ to something more nuanced” .
Longer-Term Perspective
Despite this recent shift, Bitcoin has behaved more like a growth asset than digital gold over the past 12 months, reacting to tech stock losses rather than functioning as a traditional safe haven . For Bitcoin to truly cement its “digital gold” status, this decoupling from tech cycles will need to persist.
Wintermute’s analysis notes that during the initial phase of the Middle East conflict, Bitcoin fell while gold rallied in a classic risk-off move. More recently, both assets have risen together while the U.S. dollar weakened .
Macro Factors: The Bigger Picture
Bitcoin as a Macro Asset
Bitcoin in 2026 is no longer driven primarily by its four-year halving cycle or ideological narratives. It’s a flow-driven macro asset, with price determined by the tension between ETF distribution and global liquidity conditions .
Key Macro Forces
| Factor | Current State | Impact on Bitcoin |
|---|---|---|
| Federal Reserve policy | Rate cut expectations uncertain | Higher rates pressure risk assets |
| CPI/inflation data | Pending March releases | Could shift rate expectations |
| Dollar strength (DXY) | Strengthened from recent lows | Strong dollar historically negative for BTC |
| Global liquidity | Mixed | Bull case requires easing real yields |
| Tariff uncertainty | Ongoing | Dampens risk appetite |
The “Macro Ceiling”
According to 21Shares’ 2026 outlook, Bitcoin faces a “macro ceiling” even as ETF flows provide a “gravity” anchor. In a bear case scenario of prolonged risk-off and tighter policy, sustained ETF outflows could push BTC to $60,000-75,000. In a bull case with renewed liquidity cycles, $150,000+ is possible.
Regulatory Developments
Regulatory discussions at events like the DC Blockchain Summit add another layer of uncertainty. Policy risk in 2026 is about “plumbing rather than prohibition” – how rules affect liquidity, balance sheet incentives, and forced flows .
On March 2, the SEC submitted a draft token classification framework to the White House aimed at replacing case-by-case enforcement with broader rules . The CLARITY Act continues moving through Congress with bipartisan support, which would classify digital assets as commodities under the CFTC .
Institutional Sentiment: Dip Buyers Return
What the Flows Tell Us
The recent ETF inflows appear to reflect outright bullish positioning rather than market-neutral strategies like basis trades. Yields on those trades remain relatively low, and open interest on CME futures has declined, suggesting these are straightforward bets on price direction.
BlackRock’s Conviction
Nate Geraci, president of the ETF Store, notes: “It’s easy to frame this as BlackRock simply promoting its highest-revenue product. But I see it more as the firm doubling down on its conviction that bitcoin belongs in diversified portfolios.” BlackRock’s IBIT is down about 4% this year—asset managers rarely highlight lagging funds unless they believe strongly in the long-term case.
Who’s Buying
| Investor Type | Behavior |
|---|---|
| Institutional | Returning after de-risking early 2026 |
| Retail | Cautious; spot volume low |
| Corporates | Strategy (MSTR) now holds 738,731 BTC |
| 401(k) channel | Potential future catalyst (1% allocation = $90-130B inflows) |
Strategy (formerly MicroStrategy) continues accumulating, adding 3,015 BTC for $204 million at roughly $67,700 per coin . The firm’s total holdings now represent approximately 3.5% of Bitcoin’s total supply .
Whale Activity
Santiment data shows that between February 23 and March 3, whales accumulated heavily. When Bitcoin reached $74,000, they began taking profit, selling roughly 66% of those purchases within 48 hours . This left retail buyers to absorb the dip, which often leads to extended corrections.
The Bottom Line
After months of withdrawals, the reversal in ETF flows suggests institutional investors are growing more comfortable with Bitcoin’s current levels. The “higher low” during weekend geopolitical stress helped restore confidence .
What to Watch in Q2 2026
Key Catalysts
| Catalyst | Timing | Potential Impact |
|---|---|---|
| Sustained ETF inflows | Daily/weekly | Continued inflows would support recovery |
| CPI/inflation data | March releases | Could shift Fed expectations |
| Fed policy signals | Ongoing | Rate cuts = positive for BTC |
| Geopolitical developments | Uncertain | Iran conflict remains volatile |
| Regulatory clarity | 2026 ongoing | MiCA implementation, US developments |
Levels to Watch
- Breakout confirmation: Above $71,900 strengthens recovery
- Major trend shift: Above $78,500 would suggest new uptrend
- Defense line: Holding $62,800 keeps bottom intact
Analyst Outlook
Bitcoin currently shows signs of trying to recover from the bottom, though the breakout from the broader downtrend still requires confirmation . The medium-term fundamentals look strong; short-term conditions remain uncertain due to low liquidity and macro factors.
Aurelie Barthere, principal research analyst at Nansen, notes: “Bitcoin’s downside sensitivity has been relatively limited” compared to traditional benchmarks, suggesting the marginal seller may be less aggressive than in equities .
Joe Edwards, head of research at Enigma, adds: A sustained recovery in ETF demand could be critical, and the “good news” is that there are signs of the outflow period ending .
Our Analysis Summary
Key Takeaways
| Factor | Current State | Outlook |
|---|---|---|
| ETF Flows | $1.7B+ inflows since late Feb | Bullish if sustained |
| Price Action | +20.5% from February lows | Cautiously bullish |
| Gold Correlation | Flipped to +0.16 | Potentially game-changing |
| Geopolitical Risk | Iran conflict, oil near $100 | Bearish headwind |
| Technical Levels | $71,900 resistance, $62,800 support | Mixed – breakout needs confirmation |
The Bottom Line
Bitcoin is showing genuine signs of structural maturation in March 2026. The return of institutional flows, the decoupling from software stocks, and the shifting relationship with gold all point to a market that’s evolving beyond pure speculation.
However, near-term uncertainty remains high. Low liquidity, whale activity, and macro headwinds mean price action could stay choppy. The next few weeks will be critical: sustained ETF inflows and a clean break above $71,900 would strengthen the recovery case, while a drop below $62,800 would signal deeper trouble.
For now, Bitcoin is doing something it’s rarely done before: holding its ground while the world burns. That alone is worth watching.
Disclaimer: This analysis is for informational purposes only and does not constitute financial advice. Cryptocurrency markets are volatile – always do your own research before making investment decisions.
This analysis reflects data available as of mid-March 2026. Market conditions change rapidly. Verify current prices and flows before making decisions.
Frequently Asked Questions
How much have Bitcoin ETFs flowed in March 2026?
Since late February, spot Bitcoin ETFs have seen approximately $1.7 billion in inflows, including nearly $1 billion into BlackRock's IBIT . March is on track for the longest stretch of inflows since July 2025.
What is the correlation between Bitcoin and gold now?
The BTC-gold correlation has flipped positive to +0.16 from -0.49 a week ago, suggesting investors may be treating both as beneficiaries of dollar softness rather than opposing trades .
Is Bitcoin bottoming in 2026?
The 20.5% recovery from February lows and reversal of ETF outflows suggest a potential bottom, but confirmation requires a break above $71,900 and sustained macro support .
What are the key Bitcoin price levels to watch?
Upside: $71,900 (first barrier), $78,500 (major trend shift). Downside: $69,000 (first support), $62,800 (critical defense line), $60,000 (strong psychological support) .
Are institutions buying Bitcoin ETFs again?
Yes. After $2.6B in outflows YTD through February, institutions have returned with $1.7B+ in recent weeks, suggesting dip buying .
How do ETF flows affect Bitcoin price?
ETF flows are now the dominant driver of Bitcoin's market structure, replacing the four-year halving cycle as the primary price determinant .
What happened to Bitcoin in February 2026?
Bitcoin dipped to ~$63,000 in February amid geopolitical tensions and ETF outflows, before recovering 20.5% in March .
What is the whale ratio and why does it matter?
The whale ratio measures large holder activity. At 0.64 (highest in 10 months), it indicates large holders are moving Bitcoin to exchanges, which could increase selling pressure .
Is Bitcoin decoupling from tech stocks?
Early signs suggest yes. Over five days, IBIT is up 3.75% while the software ETF (IGV) is down 2.45% - a notable decoupling from recent tight correlation .